

1. Introduction
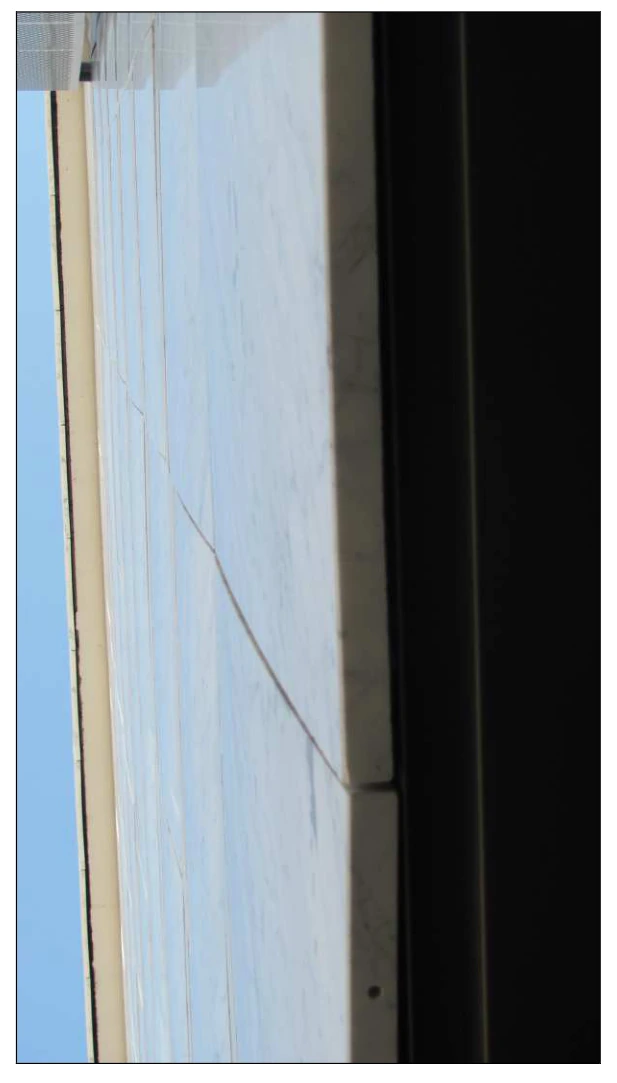
↑ ContentsMarmotest was commissioned to assess damage to marble panels used as external building cladding. The panels on both façades were bowed, as shown in photographs 1 and 2.
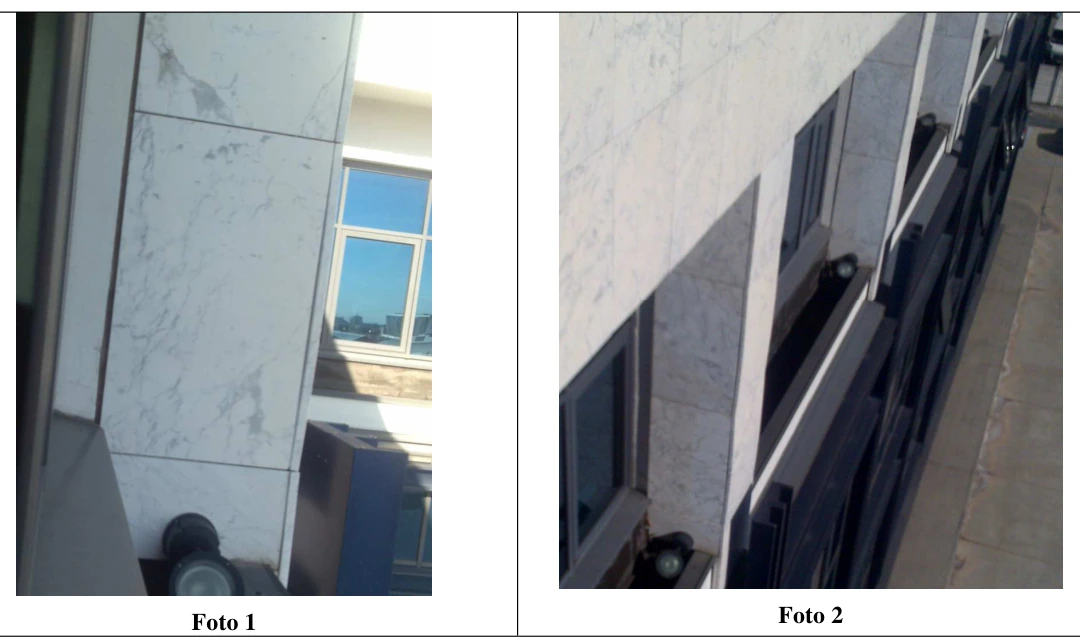
The cladding was installed in 2000. After approximately ten years the marble panels developed what is commonly called “bowing”: visible panel curvature caused by hygrothermal damage.
Marmotest studied the structural behaviour of the panels and the remaining service life of the cladding. Two site inspections included photographic and instrument surveys, together with tests to assess the most significant mechanical parameters. During the first inspection, rebound-hammer measurements were taken on a slab fragment left on the roof, using a Type L Schmidt rock hammer. During the second inspection, all slabs were carefully examined visually and approximately twenty panels were measured using a bow-meter.
In addition to the field work, an external cladding slab was sampled for the following tests: tensile strength determination following ASTM C880; impact energy according to UNI EN 14158; petrographic microscopic examination to establish crystallographic characteristics and intergranular damage; and several accelerated bowing ageing cycles using the NT499 apparatus. These tests established residual material strength, susceptibility to bowing, whether the bowing process remained active, and whether further exposure could continue to cause damage.
2. General building information
↑ ContentsCooling/heating system: air-handling units with outlets located in the suspended ceiling.
Nearest weather station: Verona Villafranca military airport. Building orientation: clad façades facing southeast and northwest.
2.1. Panel characteristics and anchorage type
↑ ContentsThe cladding consists of marble panels of varying dimensions and identical thickness. The material has a milky-white background with grey-black veins caused by concentrations of microcrystalline pyrite.
Background colour, grain size and veining identify a specific commercial variety. In addition to differences in colour and grain size, there are significant variations in mechanical strength and long-term durability.
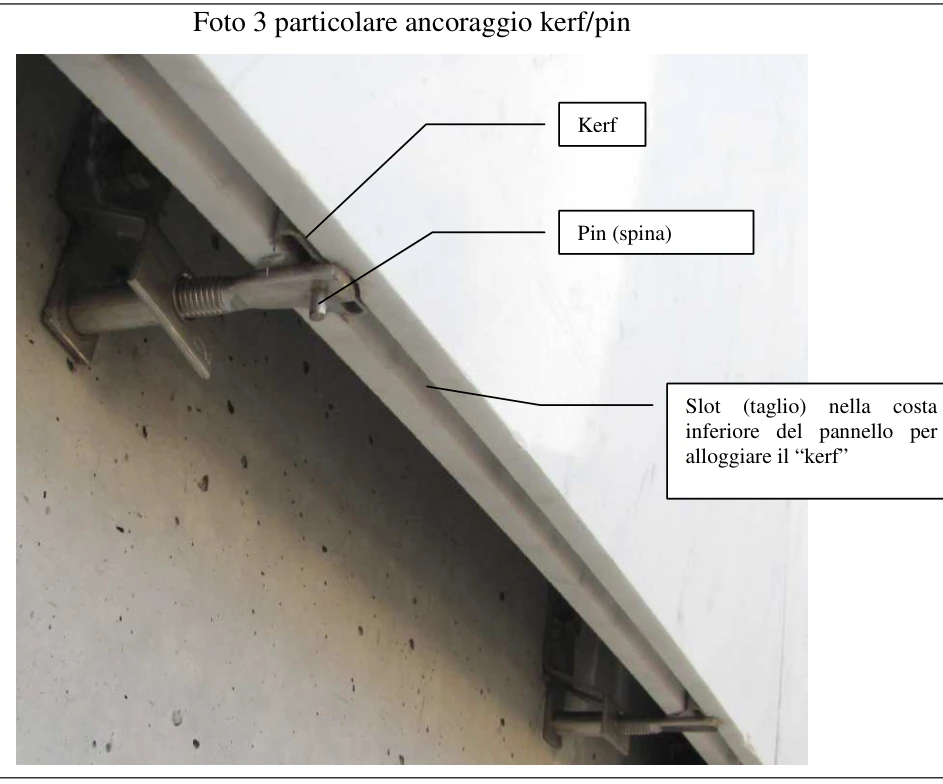
The cladding is a ventilated façade: the anchorage leaves an air cavity between the external cladding and the building, contributing to thermal insulation. The slabs are anchored using Fischer F10 fixings. Generally, the slab’s lower edge is supported by a kerf anchorage and its upper edge restrained by pins. The Fischer fixing can accommodate either kerfs or pins, as shown in image 3. In contrast to image 3, the configuration used for almost all slabs is an F10 fixing with an upper kerf and lower pin. Each bracket therefore anchors two panels: it supports the upper panel through a kerf engaging a slot along the slab’s lower edge, while its pin only holds the lower panel upright, carrying no vertical load and contributing nothing to support of that panel’s weight. Only some uppermost panels are supported by lateral pins.

The anchorage can accommodate the thermal deformation of an external cladding slab of these dimensions. Assuming a conservatively high linear thermal expansion coefficient of 0.007 mm/m°C, a one-metre slab would expand by 0.35 mm after a temperature rise of 50°C. The anchorage accommodates this deformation: the slab is free to lengthen with temperature changes without restraint from the fixing.
3.1. Site inspection on 16 November 2011
↑ ContentsThe inspection was conducted at ground and roof level; no elevated-access work or surveys were performed. Slabs up to approximately two metres high were examined, together with the uppermost row from the roof. The panels were bowed. Visually, no clear difference could be identified between the east and west façades. Although east-facing panels experience greater temperature variations and particularly more direct sunlight, this did not appear to affect bowing. Numerous published cases also show no appreciable differential bowing.

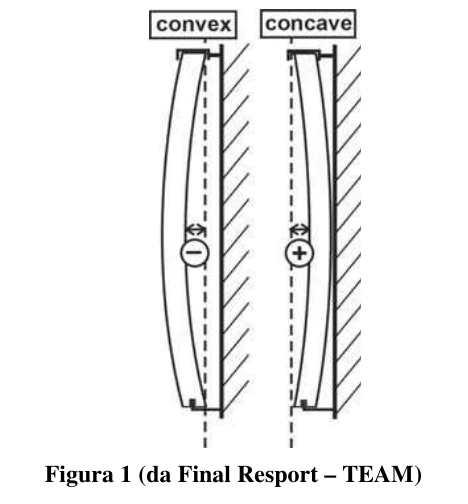
All panels show convex bowing as defined in the TEAM project (http://www-v2.sp.se/building/team/PDF/TEAMFinalReport.pdf); see the figure.
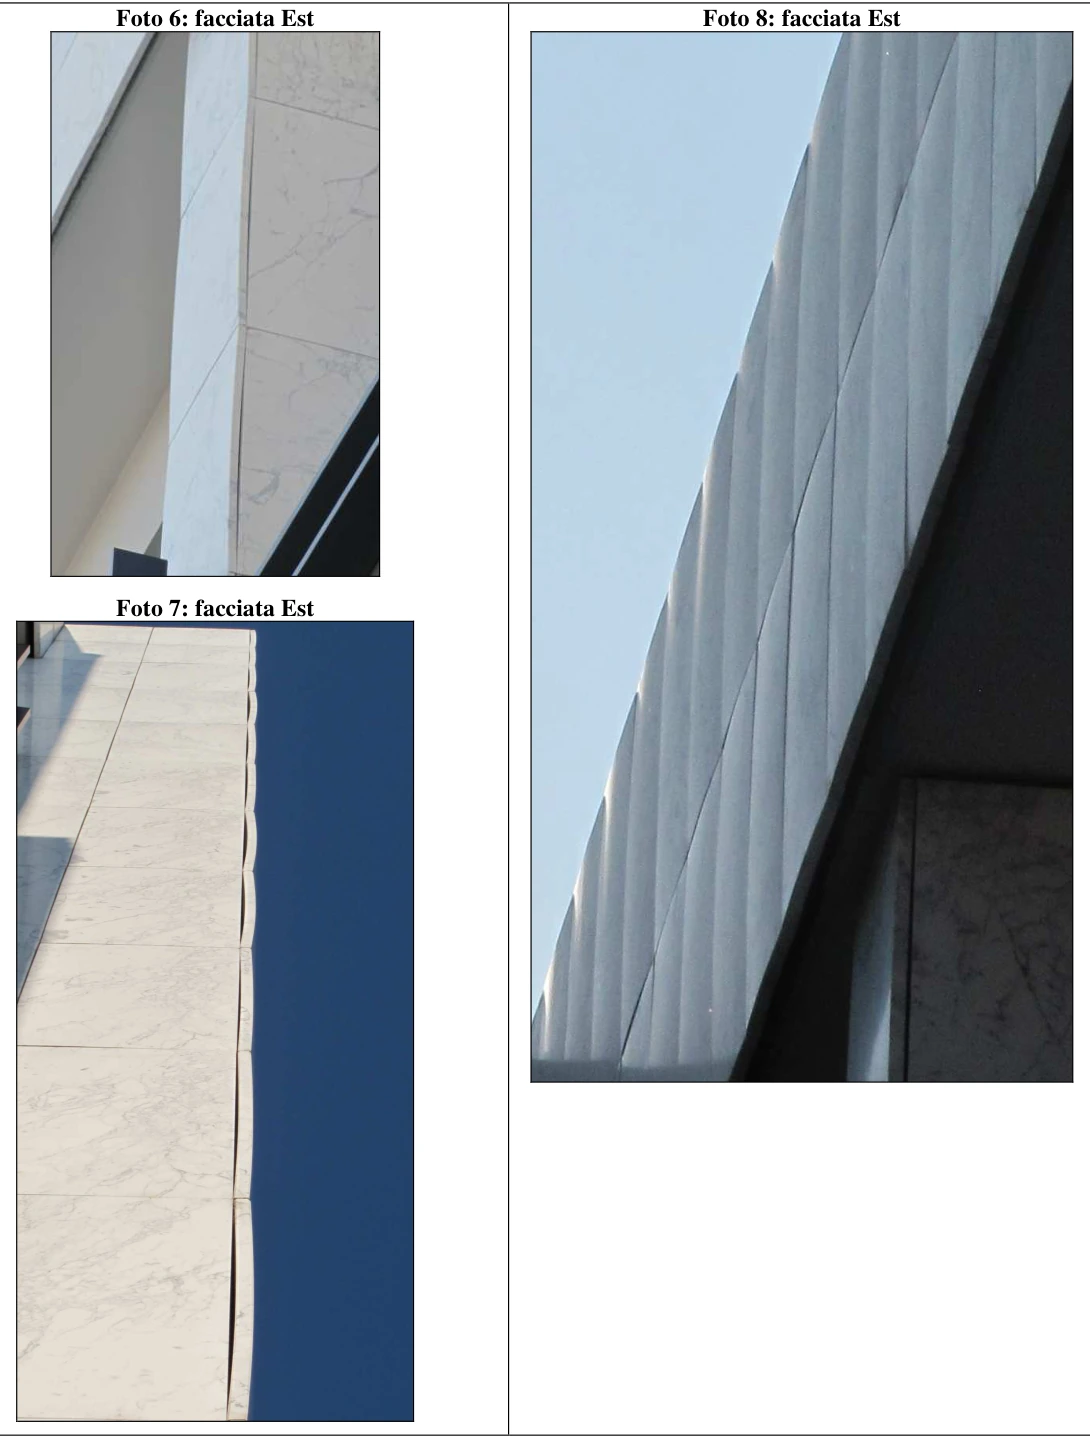

During the inspection, no cracking or spalling was observed at the anchorages. This indicates that Fischer F10 fixings do not restrain shape changes caused by thermal expansion, nor the substantially larger and more serious changes induced by bowing or expansion. Centimetre-scale discontinuities were observed in almost all slabs examined from the ground. In ISRM terminology, a discontinuity is a general fracture within the rock matrix. In a few cases they reached decimetre-scale lengths, as in photograph 10. Their edges were frequently darkened, and fractures were more developed on the outer than the inner panel face, generally following the marble’s direction of least resistance: its veining fabric. Darkened edges indicate older defects already oxidised over several years. Differences in fracture traces between the outer and inner faces result from movement imposed during bowing and weakening of the outer face. Propagation approximately parallel to the veining is natural, because a fracture develops so as to minimise fracture energy. This also indicates quasi-static propagation. During the first inspection, a broken slab fragment was found abandoned on the roof and exposed to weather. Preliminary measurements were taken on these pieces with a Type L Schmidt rock rebound hammer.
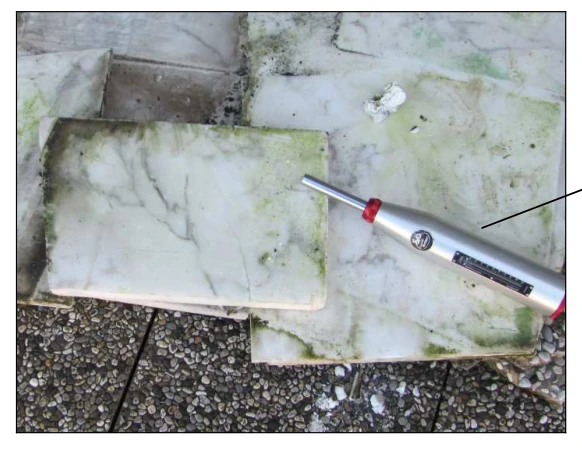
Type L rock rebound hammer
Measurements A were taken on the marble most exposed to weather. Measurements B and C were taken on portions protected by A and therefore less exposed. All measurements used the hammer vertically. The Type L Schmidt hammer, with impact energy 0.74 J, is designed to estimate the surface compressive strength of stone from its rebound index. Its operation is based on a striking mass rebounding from a piston resting against the surface: the higher the strength, the greater the rebound.
| 1 2 3 4 5 6 7 8 9 10 | A [SRH] | s [MPa] c | |
|---|---|---|---|
| 1 | 14 | 22 | |
| 2 | 14 | 22 | |
| 3 | 18 | 28 | |
| 4 | 20 | 31 | |
| 5 | 16 | 25 | |
| 6 | 18 | 28 | |
| 7 | 22 | 34 | |
| 8 | 18 | 28 | |
| 9 | 18 | 28 | |
| 10 | 22 | 34 | |
| MAX 22 34 | |||
| MIN 14 22 | |||
| MEAN 18 28 | |||
| ST. DEV. 2,8 |
| 1 2 3 4 5 6 7 8 9 10 | B [SRH] | s [MPa] c | |
|---|---|---|---|
| 1 | 26 | 42 | |
| 2 | 26 | 42 | |
| 3 | 26 | 42 | |
| 4 | 24 | 38 | |
| 5 | 28 | 45 | |
| 6 | 28 | 45 | |
| 7 | 24 | 38 | |
| 8 | 24 | 38 | |
| 9 | 24 | 38 | |
| 10 | 28 | 45 | |
| MAX 28 45 | |||
| MIN 24 38 | |||
| MEAN 26 41 | |||
| ST. DEV. 1,8 |
| 1 2 3 4 5 6 7 8 9 10 | C [SRH] | s [MPa] c | |
|---|---|---|---|
| 1 | 24 | 38 | |
| 2 | 28 | 45 | |
| 3 | 26 | 42 | |
| 4 | 26 | 42 | |
| 5 | 24 | 38 | |
| 6 | 28 | 45 | |
| 7 | 28 | 45 | |
| 8 | 28 | 45 | |
| 9 | 26 | 42 | |
| 10 | 26 | 42 | |
| MAX 28 45 | |||
| MIN 24 38 | |||
| MEAN 26 42 | |||
| ST. DEV. 1,6 |
Compressive strength σc [MPa] was estimated from Schmidt Rebound Hardness [SRH] using the ISRM correlation chart in Suggested Method for the Quantitative Description of Discontinuities. Measurements at B and A differed by 23.4%. Estimated compressive strength C0 is shown in the table, assuming bulk density of 2.7 t/m³. Greater water exposure reduced the mechanical properties of portion A by approximately 24%. The marble fragments were outdoors on the roof but had limited sunlight exposure.
The preliminary examination immediately revealed the following observations:
Slab portions covered by other fragments gave higher rebound values, indicating weather-related damage. Environmental action therefore caused both bowing and reduced mechanical properties. The examined portions had relatively low compressive strength. Although rebound testing is a preliminary rather than precise method, the particularly low values indicated the need for thorough laboratory strength testing. The inspection showed that more accurate determinations were required, specifically constant-moment flexural strength, preferably ASTM C880, impact energy and water absorption. Petrographic examination of a discontinuity was requested to establish whether fractures were intergranular or transgranular. A further petrographic study in three orthogonal directions was requested to establish crystal shape, intercrystalline contact types and the state of intergranular decohesion. Bow-meter measurements and surveys were also identified as important.

3.2. Second site inspection
↑ Contents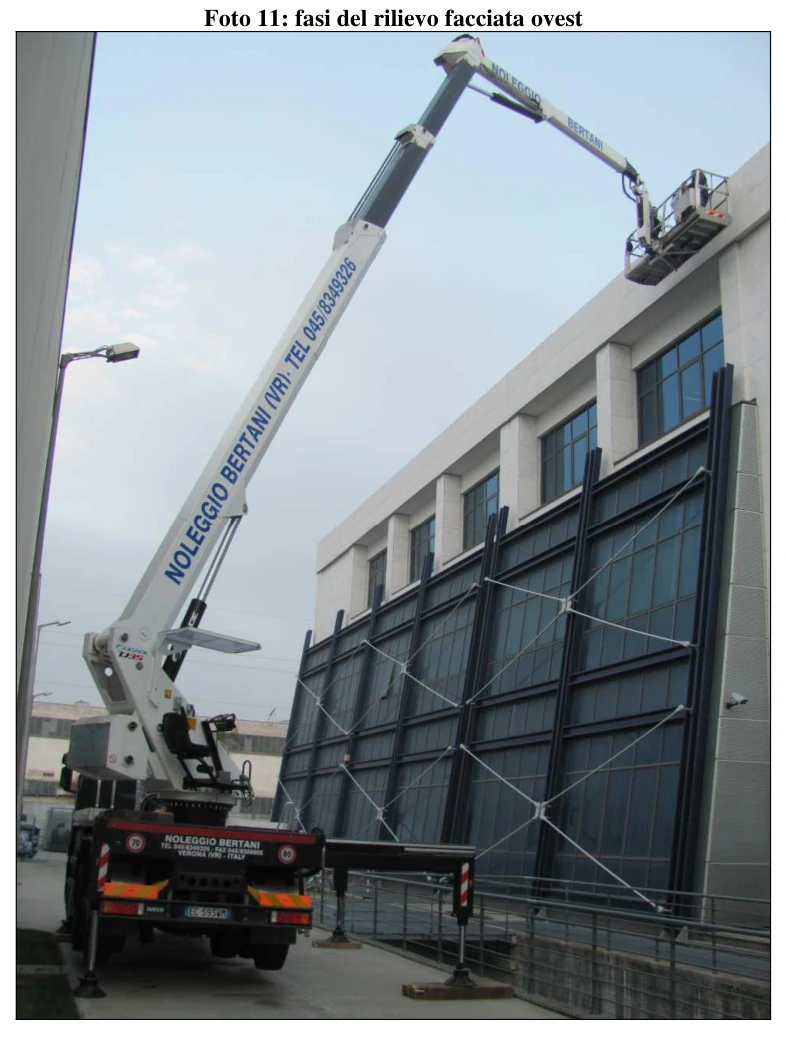
The purpose of the inspection was:
1) Visual examination of ALL panels to identify critical conditions, specifically:
a. Establish whether panels at height show spalling or fractures at anchorages;
b. Check for discontinuities or newly formed fractures and identify any marble portions isolated by fractures and consequently unstable;
c. Establish whether deformation has brought adjacent panels into contact;
d. Identify any anchorage anomalies.
2) Instrument measurement of bowing following NT500, using a bow-meter (photograph 12). The bow-meter is a gauge with 0.01 mm precision and an adjustable measurement base, designed for measuring curved cladding panels. The instrument, measurement procedure and survey requirements are defined in Nordtest Method NT BUILD 500, Cladding Panels: Field Method for Measurement of Bowing [http://www.nordicinnovation.net/nordtestfiler/build500.pdf]. Measurements used the survey scheme recommended in that standard (Figure 2).

A building survey-sector scheme was prepared beforehand to identify each panel uniquely. First, east and west façades were distinguished; then structural elements, specifically metal columns, were selected as starting points for counting panels (see figure).

3.2.1. Visual examination
↑ ContentsThe east-facing portion shows slightly greater surface weathering than the west-facing portion, evident in the loss of the original polish and a yellow-ochre patina that is less pronounced on the west façade.
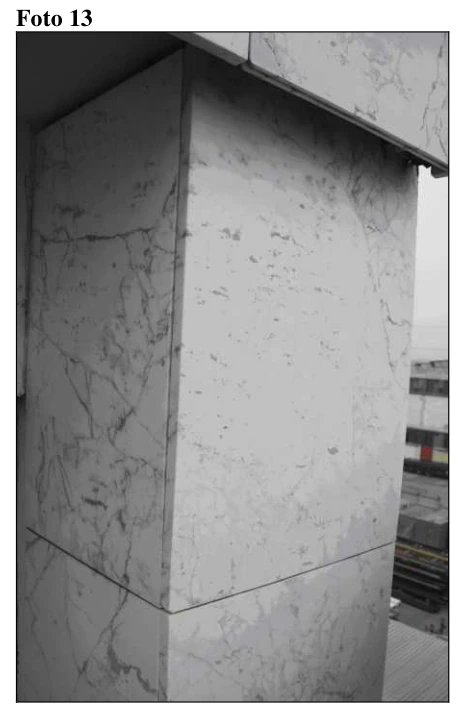
Material installed inside the columns on both façades, in a more sheltered position, shows less bowing and retains much of its original polish (photograph 13), indicating less surface deterioration. This is consistent with bowing theories in which wind accelerates the phenomenon and increases curvature by modifying the surface microclimate, particularly moisture conditions.
Close examination from an access platform reveals closed but clearly identifiable cracks along most panel edges, ranging from centimetres to decimetres in length, highlighted by accumulated external deposits.
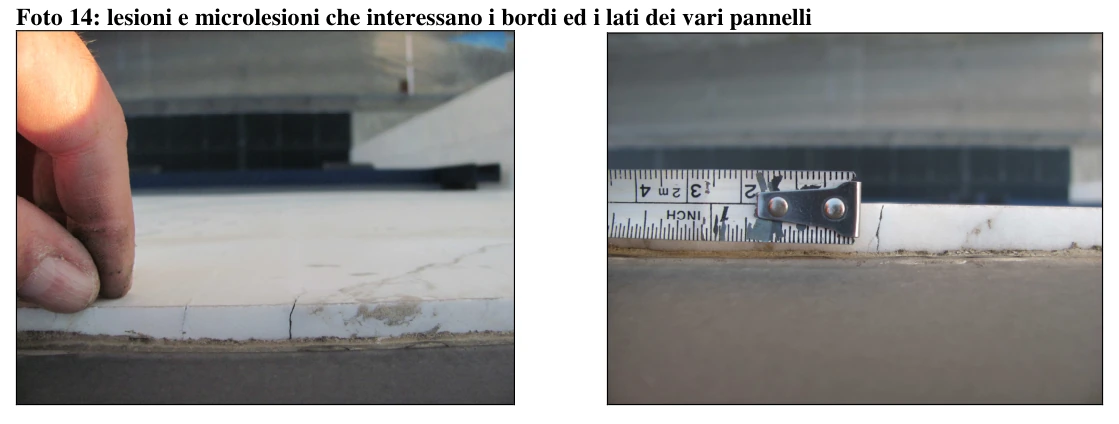
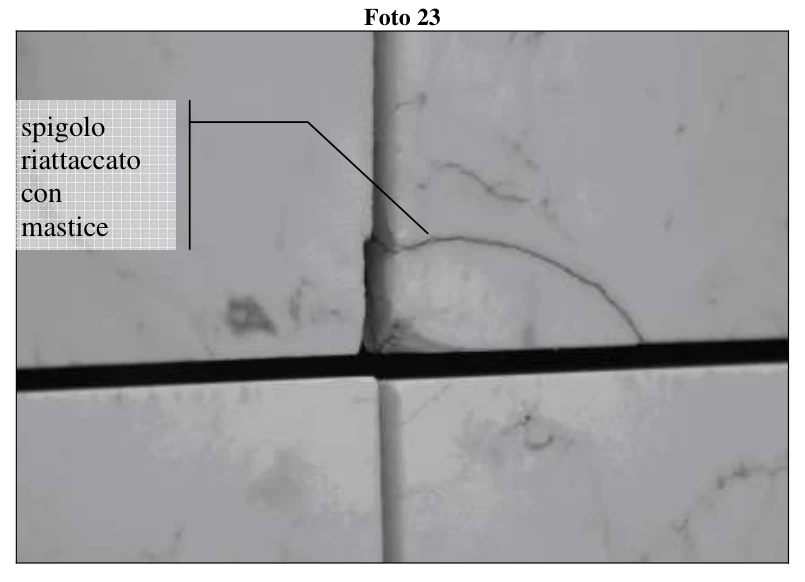
In some cases, volumetric expansion and bowing brought adjacent panel edges closer together, generating local stresses that initiated fractures and partial material detachment (photographs 15–18).

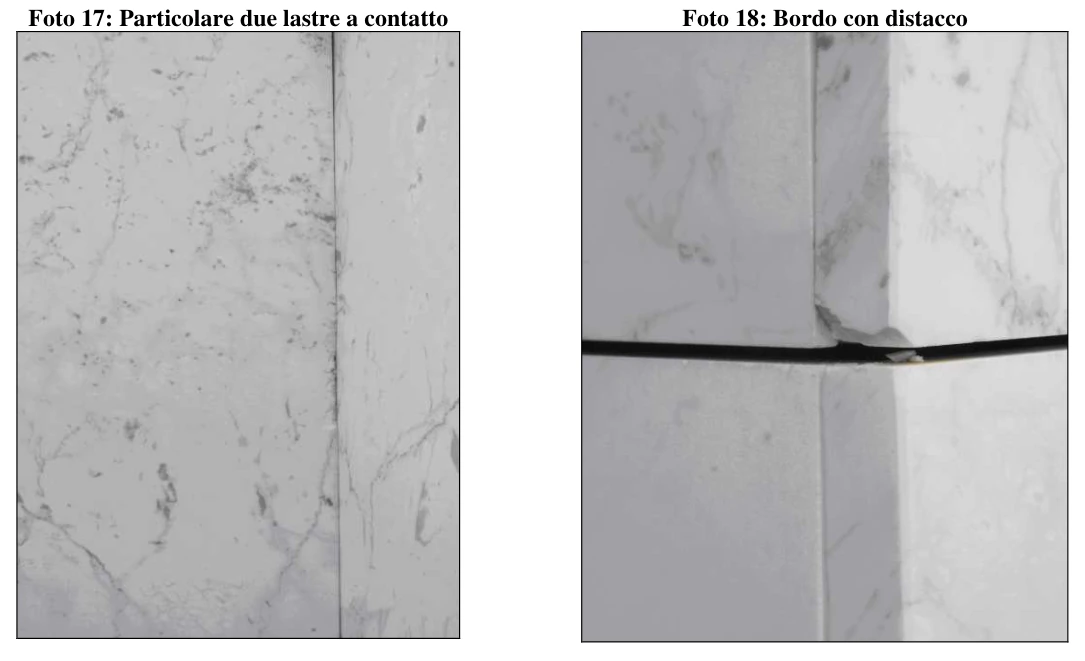
The longest fractures
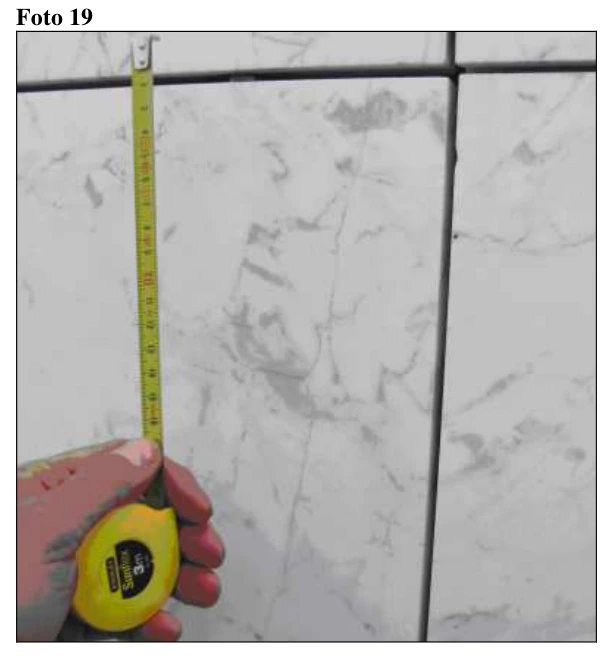
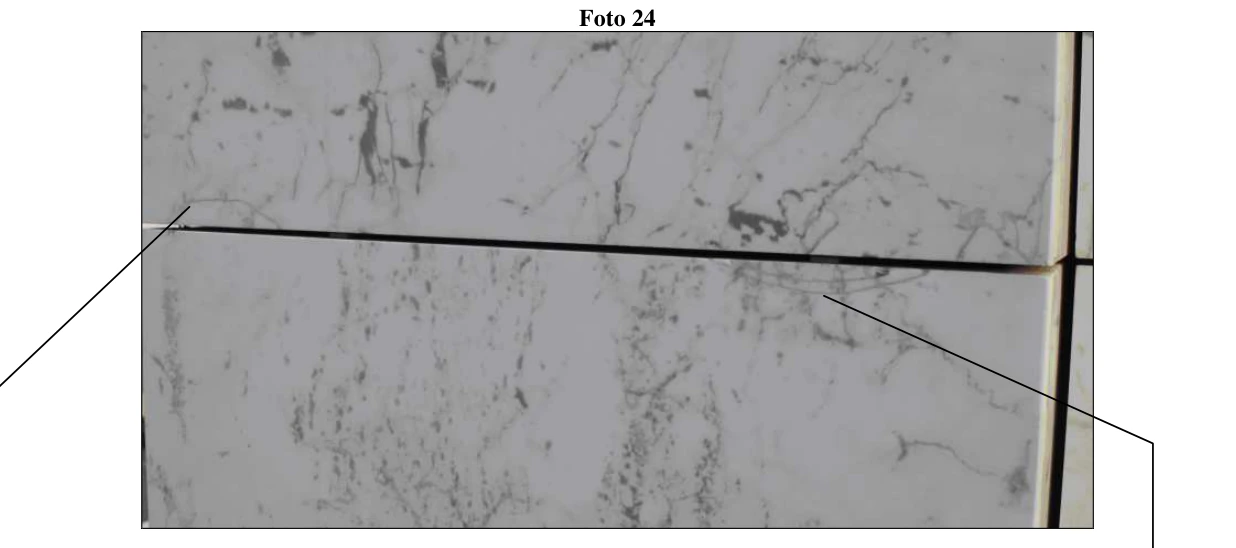
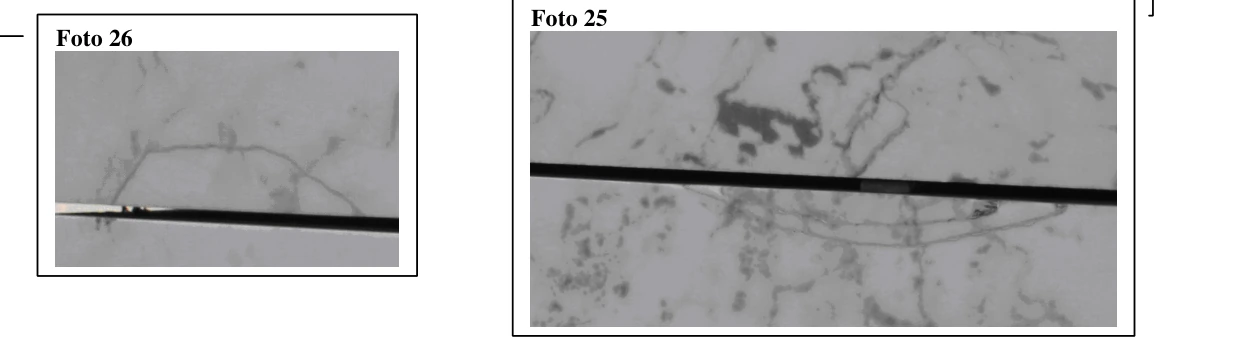
observed on some panels were nevertheless old, as indicated by their colour (see photograph). Visual examination of all panels revealed no extensive recent fractures, which would have appeared white against the background and indicated recent structural failure. Although some decimetre-scale fractures were recorded, no completely isolated portions were observed. Small marble fragments found on ledges were considered residues from later work, such as installation or removal of planters and maintenance, rather than spontaneous detachments (photographs 20 and 21).

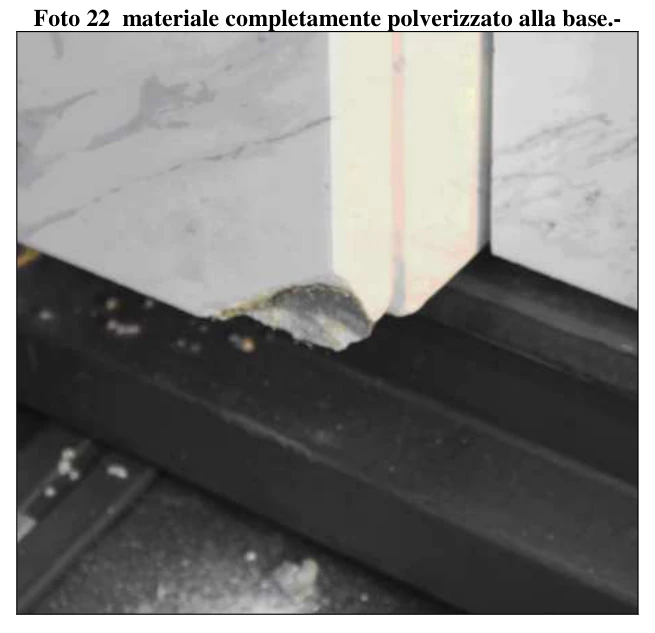
These marble fragments were weathered and showed a clear decline in physical and mechanical properties: simple pressure between the fingers caused the material to disintegrate into powder, revealing its saccharoidal texture (photograph 22).
Elsewhere, pieces such as corners and edges had been glued with stone mastic, evidently during installation (photograph 23).
3.2.2. Bow-meter measurements
↑ ContentsBow-meter measurements were taken on 22 panels, using the NT500 scheme shown in the figure for each panel.
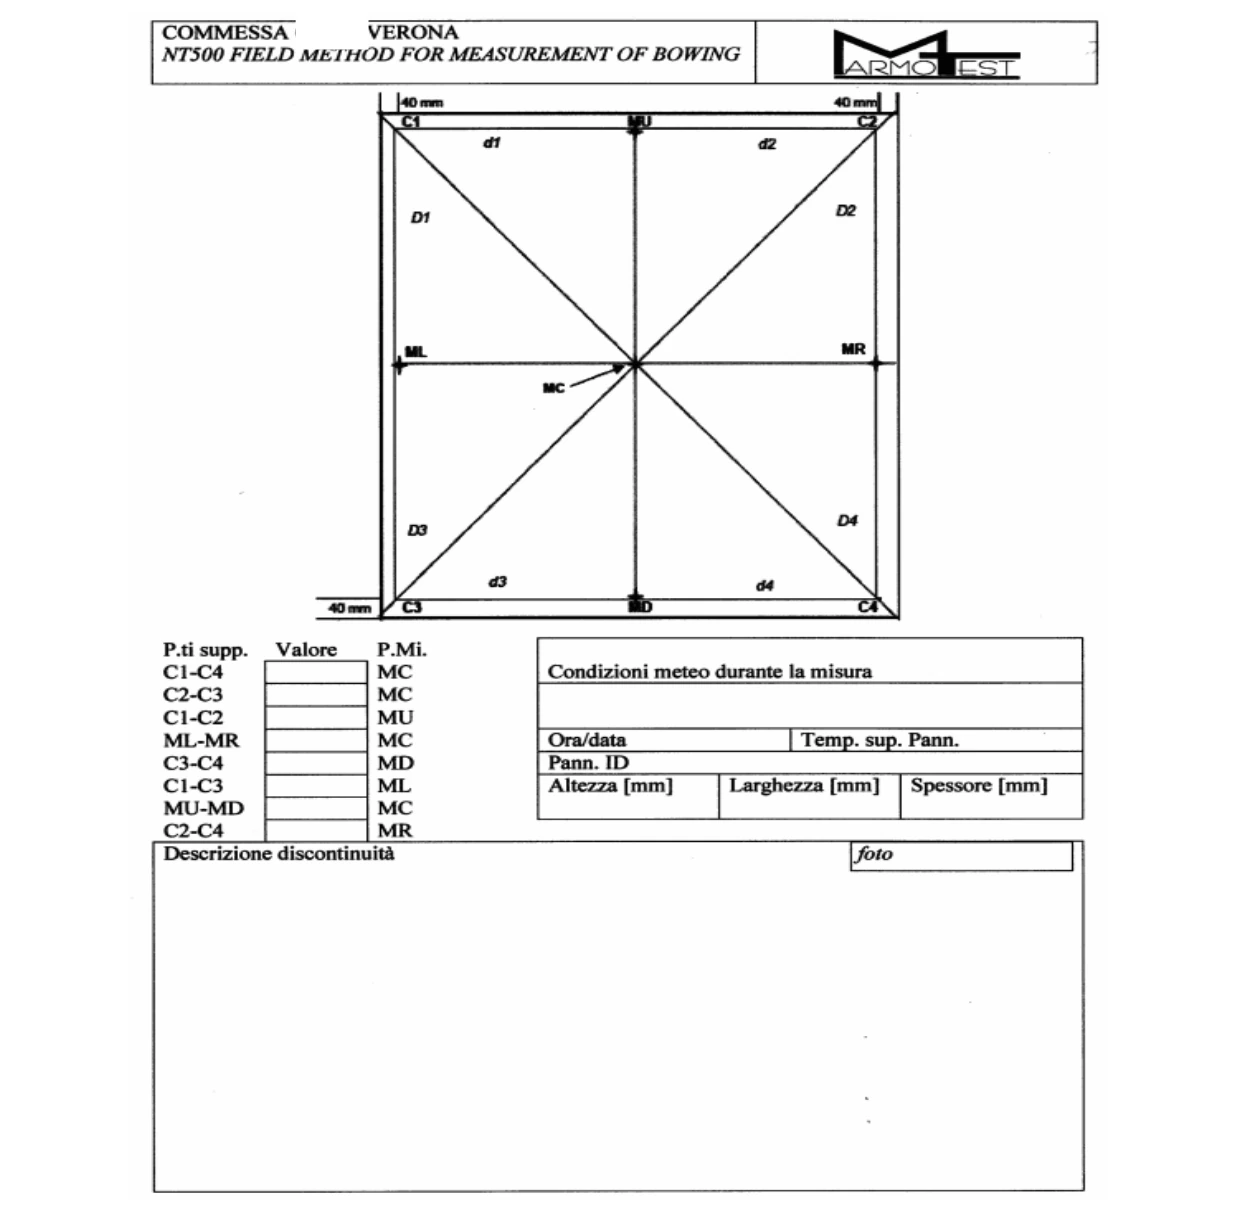
Panels were selected following NT500 to sample different microclimatic situations, including panel centres, edges and corners. The photographs show examples of measured panel identification. As required by the standard, at least one diagonal was measured on every panel; other geometric parameters were measured only on selected panels.

The bow-meter measures absolute curvature in millimetres. To compare panel bowing, it is generally appropriate to express curvature per linear metre, in mm/m, taking account of the measurement base and panel dimensions. The table gives bowing values already normalised to mm/m.
| ID | PANEL BOWING PER METRE C1-C4 C2-C3 C1-C2 ML-MR C3-C4 C1-C3 MU-MD C2-C4 [mm/m] [mm/m] [mm/m] [mm/m] [mm/m] [mm/m] [mm/m] [mm/m] | |||||||
|---|---|---|---|---|---|---|---|---|
| 1 | 8,5 | 9,0 | N.D. | 7,3 | N.D. | N.D. | 8,0 | N.D. |
| 2 | 7,4 | 9,0 | N.D. | 7,6 | N.D. | N.D. | 8,8 | N.D. |
| 3 | 11,3 | N.D. | N.D. | N.D. | N.D. | N.D. | N.D. | N.D. |
| 5 | 11,3 | 13,2 | N.D. | N.D. | N.D. | N.D. | N.D. | N.D. |
| 6 | 11,3 | 13,5 | N.D. | N.D. | N.D. | N.D. | N.D. | N.D. |
| 7 | 11,0 | 9,3 | N.D. | N.D. | N.D. | N.D. | N.D. | N.D. |
| 8 | 1,0 | 1,3 | N.D. | N.D. | N.D. | N.D. | N.D. | N.D. |
| 9 | 11,2 | 9,8 | N.D. | N.D. | N.D. | N.D. | N.D. | N.D. |
| 10 | 12,5 | 9,0 | N.D. | N.D. | N.D. | N.D. | N.D. | N.D. |
| 11 | 7,3 | 9,8 | N.D. | N.D. | N.D. | N.D. | 9,8 | N.D. |
| 12 | 10,5 | N.D. | N.D. | N.D. | N.D. | N.D. | 11,5 | N.D. |
| 13 | 4,1 | 3,2 | N.D. | N.D. | N.D. | N.D. | 4,1 | N.D. |
| 14 | 7,8 | 8,4 | N.D. | N.D. | N.D. | N.D. | 8,8 | N.D. |
| 16 | 14,1 | 16,7 | N.D. | N.D. | N.D. | N.D. | 14,8 | N.D. |
| 17 | 10,7 | 9,5 | 3,3 | 1,5 | 3,3 | 3,7 | 4,7 | 4,3 |
| 20 | 3,9 | 3,0 | N.D. | N.D. | N.D. | N.D. | 3,3 | N.D. |
| 21 | 5,1 | 6,4 | 3,1 | 3,1 | 3,8 | N.D. | 3,1 | N.D. |
| 22 | 7,3 | 4,6 | N.D. | N.D. | N.D. | 6,4 | 5,3 | 6,8 |
| MEAN | 8,4 | 8,2 | 2,7 | 4,9 | 3,1 | 4,8 | 7,2 | 5,2 |
| MAX | 13,8 | 16,4 | 2,7 | 7,4 | 3,4 | 6,2 | 14,6 | 6,6 |
| MIN | 0,7 | 1,0 | 2,7 | 2,5 | 2,7 | 3,4 | 2,7 | 3,9 |

To investigate the relationship between bowing and exposure, measurements were plotted as two series: blue for east-facing panels and the second series for west-facing panels. Contrary to the visual impression during the first inspection, the graph shows a difference in mean bowing with exposure. Recent studies indicate that the correlation between bowing and exposure is not always present.

4. Petrographic analysis
↑ Contents4.1. General microscopic characteristics
↑ ContentsFour thin sections were examined, obtained from a sample of an installed, polished slab fragment (P1–4).
Optical microscopic examination of the four sections using a Nikon Eclipse E600 POL identified a medium- to fine-grained, holocrystalline rock composed mainly of euhedral crystals. Crystal boundaries are predominantly straight, with triple junctions at crystal contacts, giving a polygonal texture. Two grain-size classes are present: medium-fine crystals of 0.3–0.5 mm and fine crystals smaller than 0.1 mm, giving an inequigranular texture. Thin elongated layers of very fine-grained calcite are also visible. These observations identify an inequigranular-polygonal texture according to Passchier & Trouw (1998); see photographs.


Photographs 28 and 29. General appearance of the rock, showing the inequigranular-polygonal texture and two main grain-size classes. Thin layers of very fine-grained calcite are also visible. Image dimensions: 8.8 × 6.6 mm.
Compositionally, more than 90% of the rock consists of calcite crystals (CaCO3) formed by metamorphic recrystallisation, rarely showing well-developed cleavage systems. Minor siliciclastic components, including quartz and/or plagioclase crystals, are also present (photograph 30).
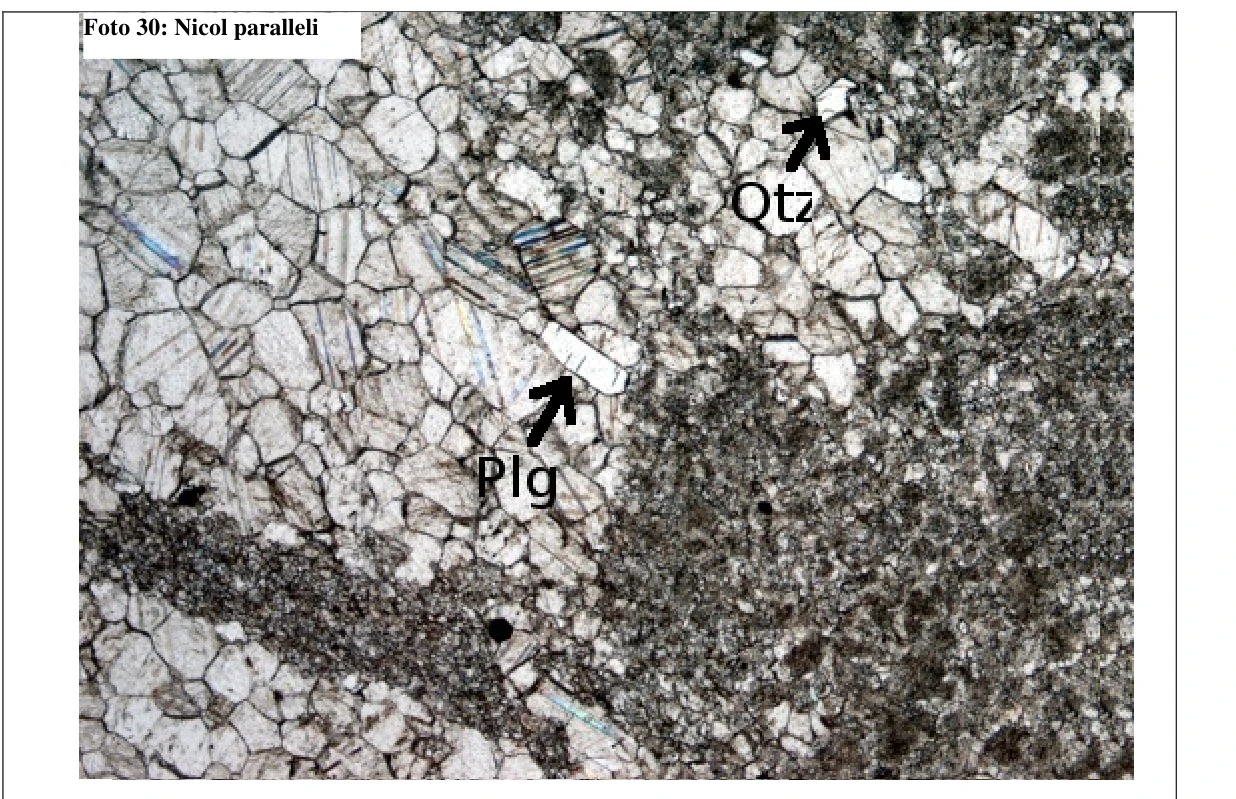
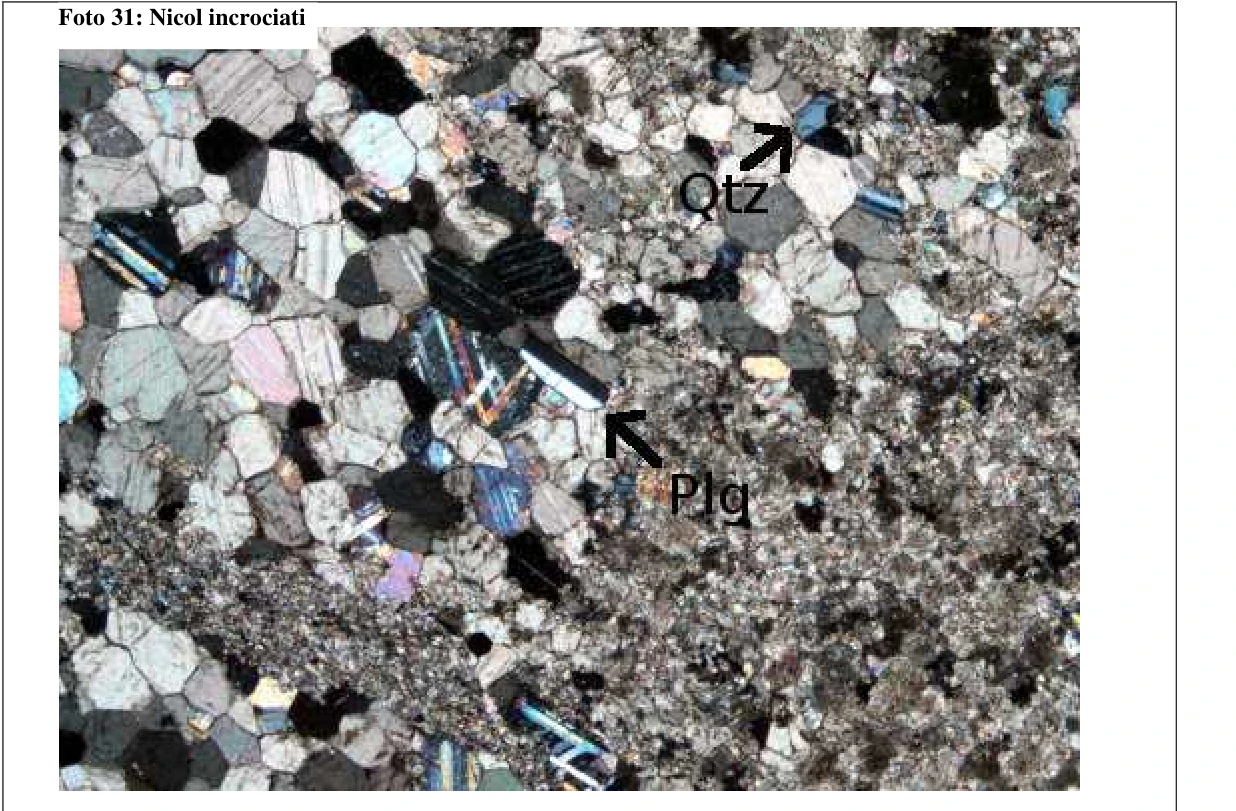
Photographs 30 and 31. Cleavage systems are visible in larger crystals, together with siliciclastic components (Qtz: quartz; Plg: plagioclase). Image dimensions: 4.4 × 3.3 mm. 2A: plane-polarised light. 2B: cross-polarised light.
Calcite crystals frequently show mechanical or secondary twins, resulting from plastic intracrystalline deformation. Twins are generally thick and straight, although some are bent. Two intersecting twin systems forming angles of 60°–120° are common. Some twins have irregular edges due to recrystallisation by grain-boundary migration. Under Burkhard’s classification (1993), the rock contains Type I, II and IV twins, indicating deformation temperatures between 150°C and 300°C.

Photographs 32 and 33. Mechanical twins in calcite crystals. Two twin systems intersect at angles of 60°–120°, and twins with irregular edges are visible. Image dimensions: 1.76 × 1.32 mm.
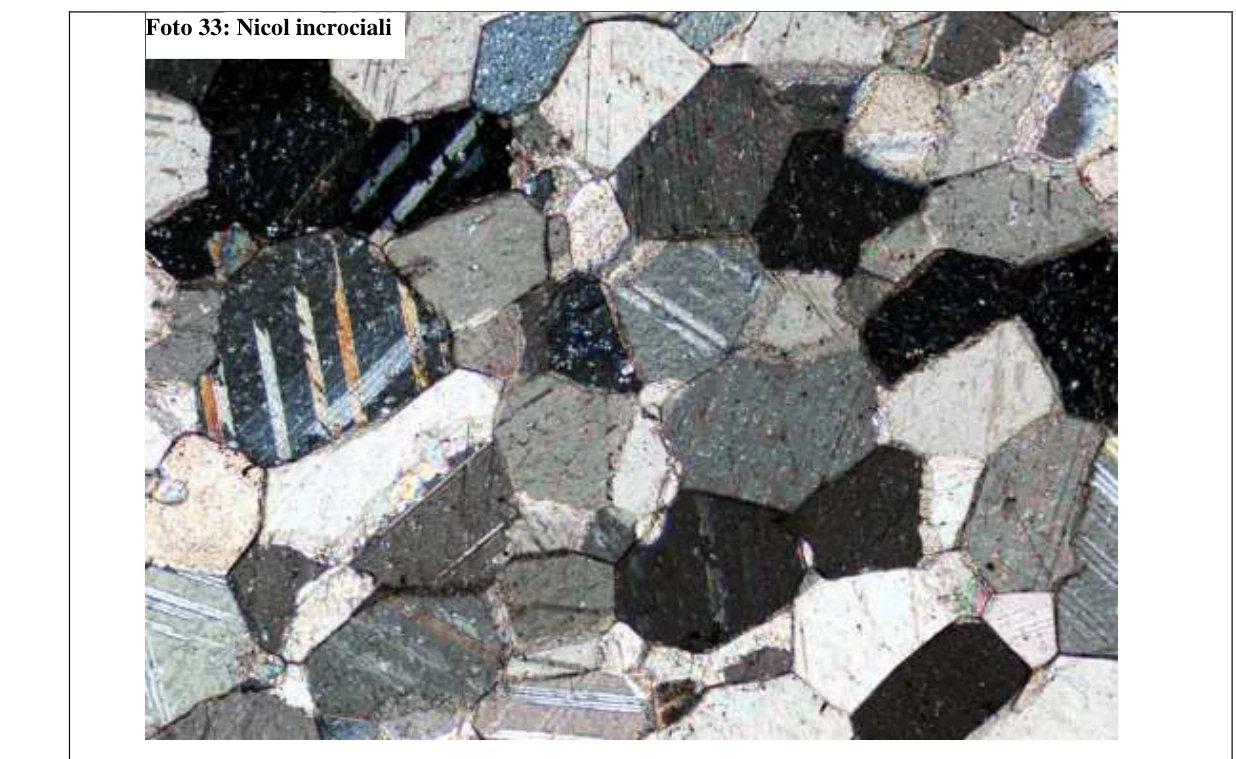
The rock shows brittle fracturing mainly at intercrystalline scale. Fractures develop along crystal boundaries without crossing the crystals, forming a characteristic stepped geometry (photographs 33 and 34). This can occur in crystalline rocks with polygonal textures because straight boundaries and triple junctions can give lower fracture resistance than interlobate or amoeboid textures, whose intercrystalline bonds are stronger. Polygonal textures also favour intercrystalline fluid circulation, which can further weaken crystal bonds and the rock overall.
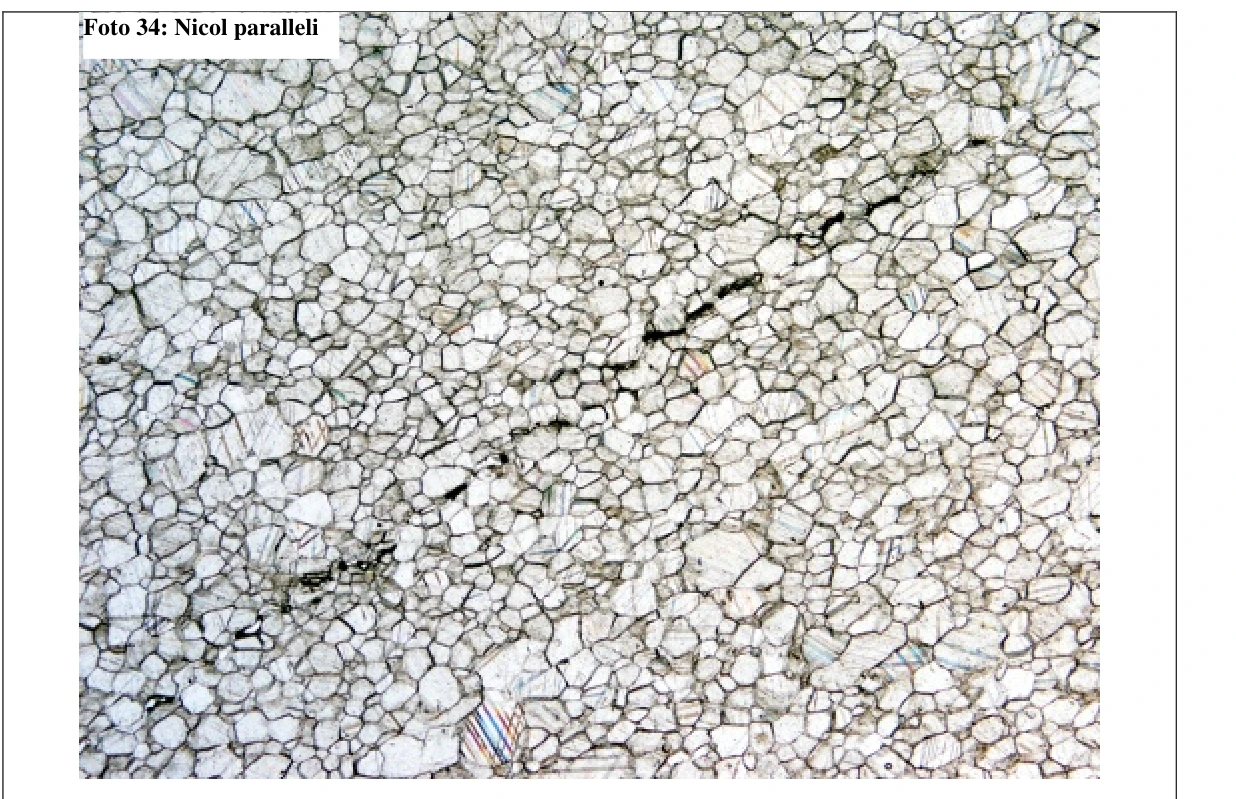
Photographs 34 and 35. General appearance of brittle intercrystalline fractures along crystal boundaries. Image dimensions: 8.8 × 6.6 mm.
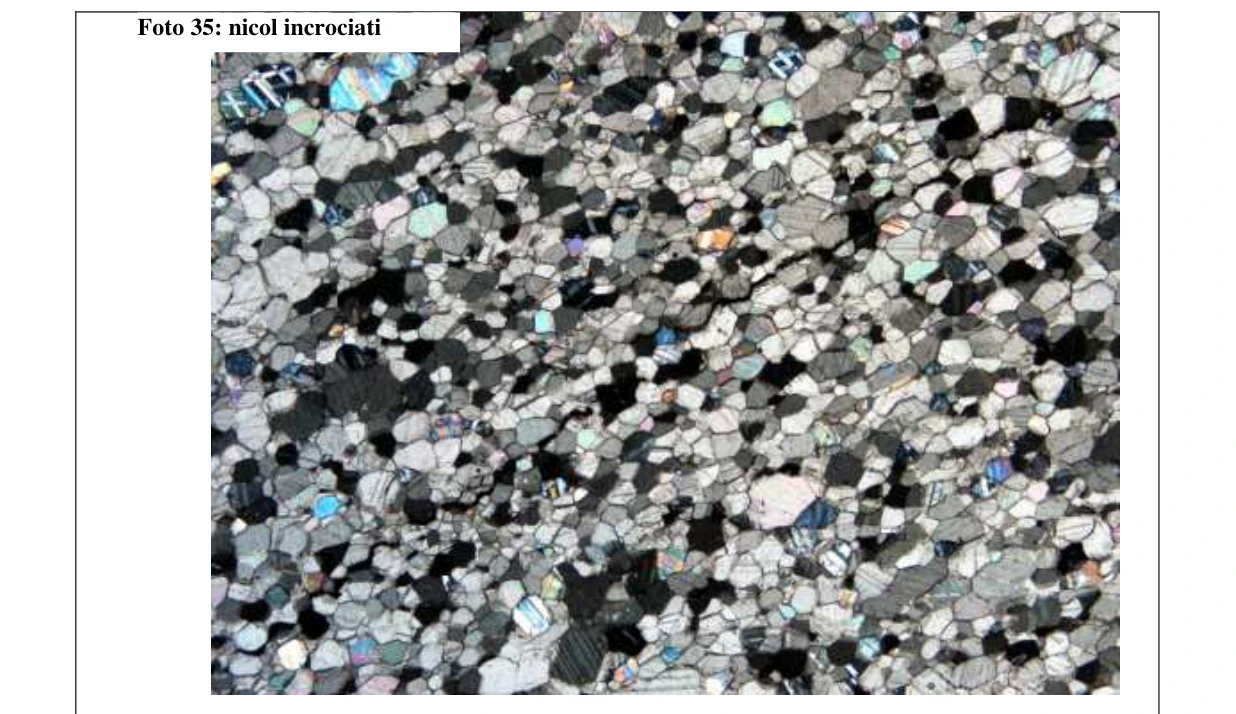
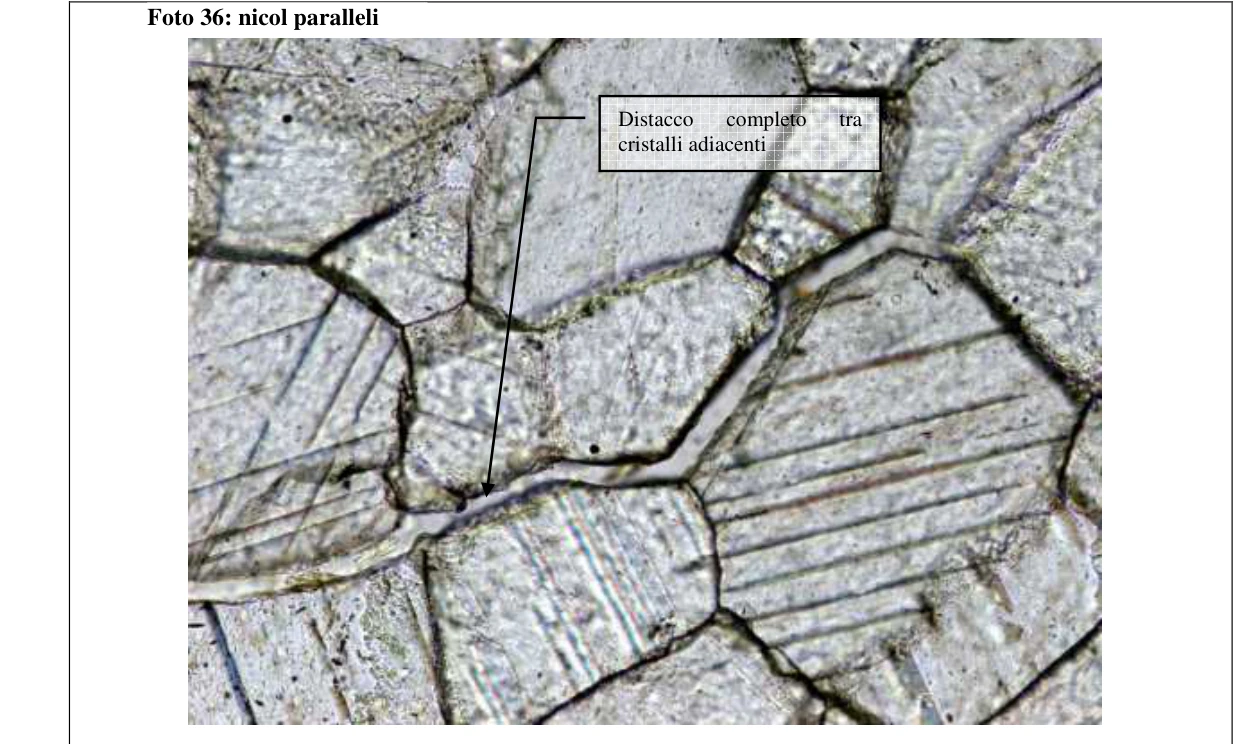
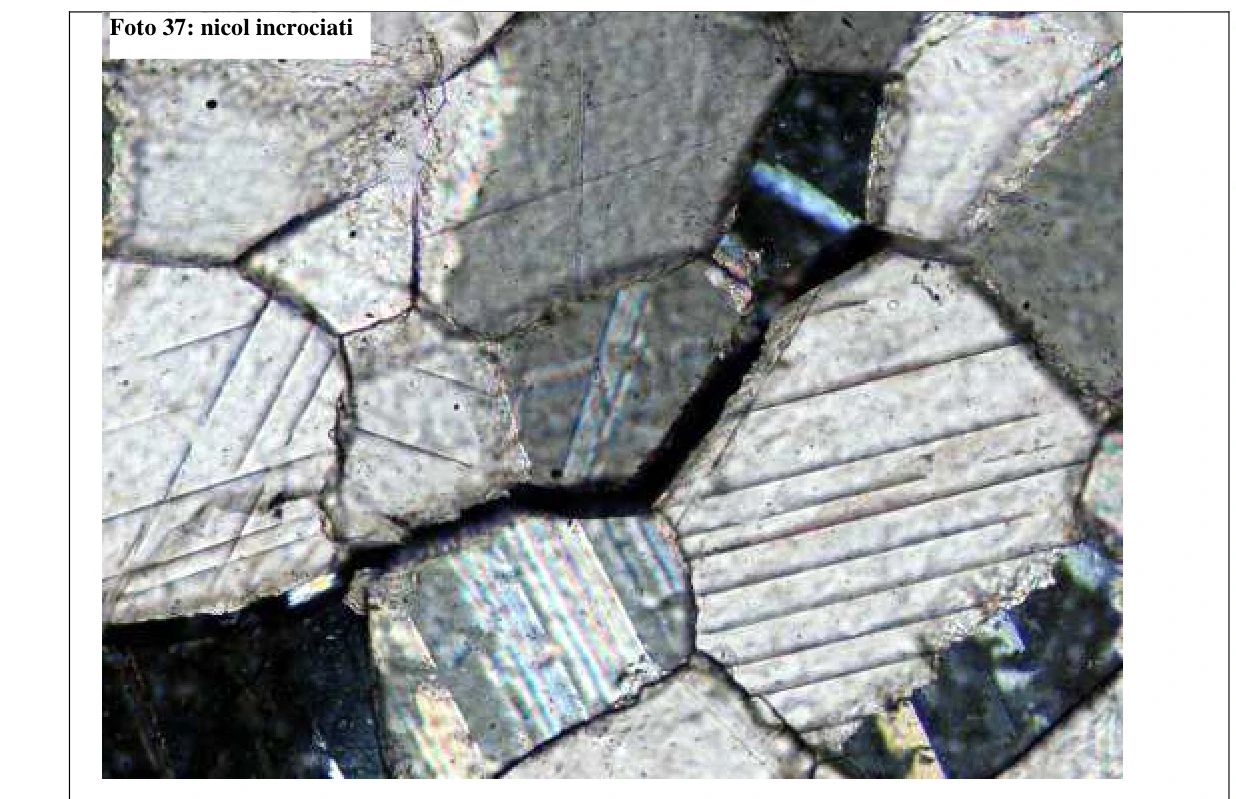
Photographs 36 and 37. Detail of brittle intercrystalline fractures along crystal boundaries. Image dimensions: 0.88 × 0.66 mm.
4.2. Classification
↑ ContentsFollowing the metamorphic rock classification guidelines of the IUGS Subcommission on the Systematics of Metamorphic Rocks (Schmid et al., 2007), the sample is classified as marble because it consists of more than 90% by volume of calcite produced by metamorphic recrystallisation. Under ASTM Designation C119-11 (2011), it is classified as calcitic marble.
For bowing assessment, the rock was classified as medium- to fine-grained marble with an inequigranular-polygonal texture, making it susceptible to bowing.
5. Meteorological data
↑ ContentsMeteorological data were collected from Villafranca di Verona, the weather station nearest the building. Historical data were analysed to define the type of damage affecting the slabs. The following tables show selected years and their mean values.
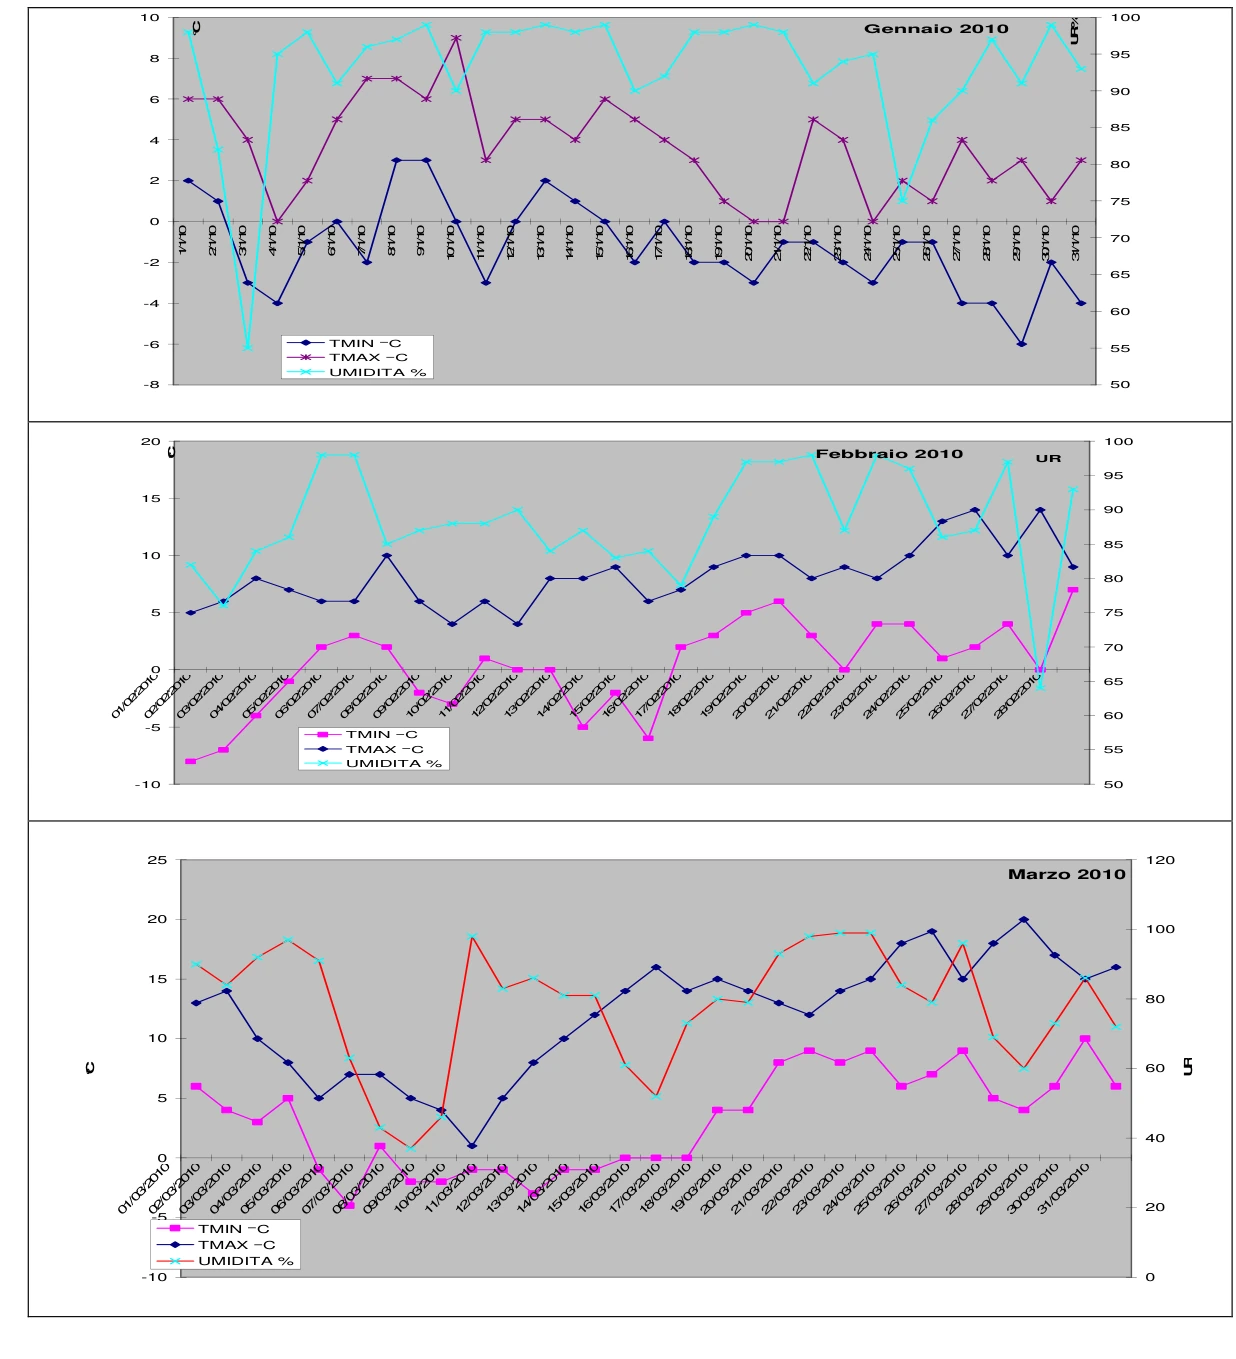

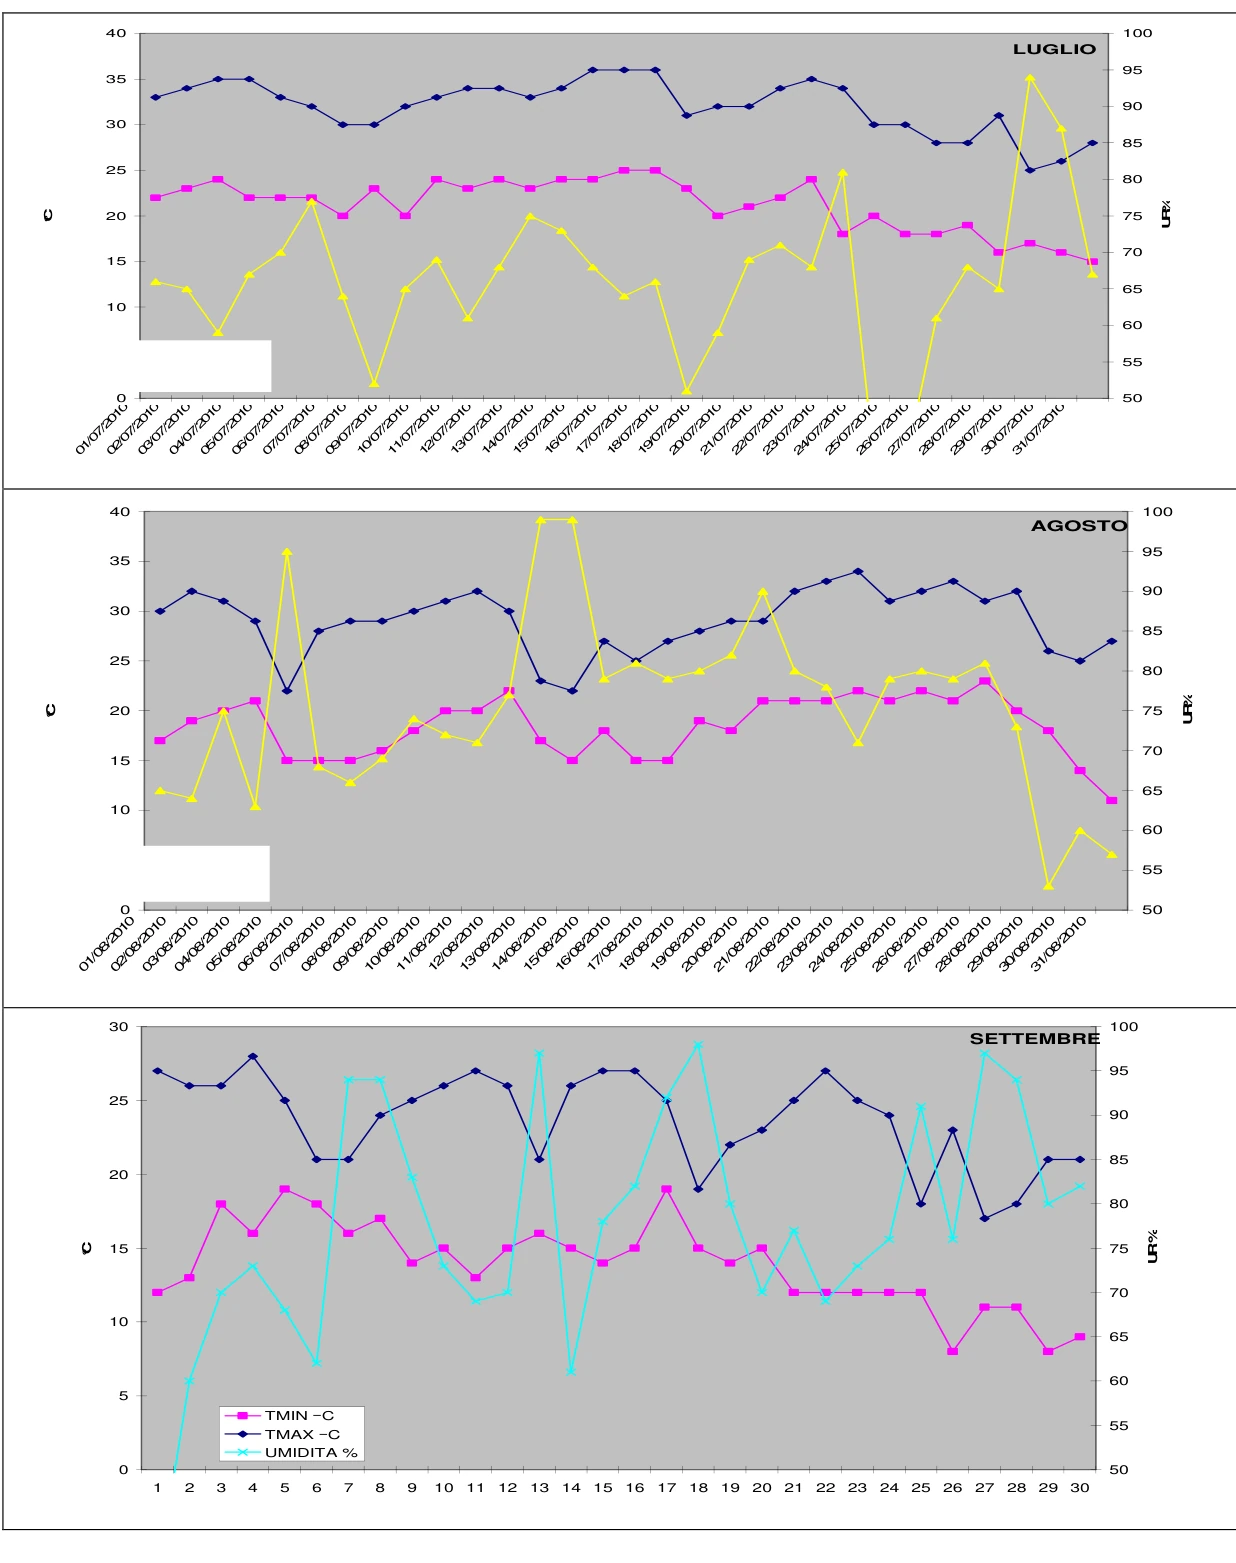

Earlier years were analysed using annual aggregates; the table summarises data by year.
| 2005 | DELTA t | Mean temperature | Minimum temperature | Maximum temperature | UR% | Wind speed km/h |
|---|---|---|---|---|---|---|
| JANUARY | 9,4 | 0,5 | -3,7 | 5,7 | 81,6 | 5,5 |
| FEBRUARY | 10,2 | 2,4 | -2,5 | 7,7 | 69,4 | 8,3 |
| MARCH | 11,8 | 7,9 | 2,2 | 14,0 | 75,3 | 7,1 |
| APRIL | 10,4 | 12,5 | 7,3 | 17,7 | 76,8 | 8,1 |
| MAY | 11,9 | 19,1 | 13,0 | 24,9 | 68,2 | 8,1 |
| JUNE | 11,5 | 23,8 | 17,7 | 29,2 | 66,1 | 9,0 |
| JULY | 11,4 | 24,9 | 19,0 | 30,4 | 72,8 | 6,7 |
| AUGUST | 10,6 | 22,2 | 16,9 | 27,5 | 77,5 | 7,9 |
| SEPTEMBER | 10,1 | 20,3 | 15,5 | 25,6 | 79,8 | 5,9 |
| OCTOBER | 7,4 | 14,0 | 10,6 | 18,0 | 87,3 | 5,9 |
| NOVEMBER | 6,5 | 11,3 | 8,5 | 15,0 | 95,5 | 4,1 |
| DECEMBER | 8,5 | 2,1 | -1,7 | 6,8 | 84,0 | 5,8 |
| 2006 | DELTA t | Mean temperature | Minimum temperature | Maximum temperature | UR% | Wind speed km/h |
|---|---|---|---|---|---|---|
| JANUARY | 9,0 | 1,5 | -2,7 | 6,3 | 86,4 | 5,9 |
| FEBRUARY | 9,2 | 4,0 | -0,2 | 9,0 | 79,9 | 6,5 |
| MARCH | 10,0 | 7,9 | 3,1 | 13,1 | 69,3 | 7,9 |
| APRIL | 12,0 | 6,0 | 7,6 | 19,6 | 70,3 | 7,3 |
| MAY | 12,3 | 18,3 | 12,0 | 24,3 | 64,7 | 8,1 |
| JUNE | 12,7 | 23,6 | 16,8 | 29,5 | 54,6 | 8,5 |
| JULY | 12,7 | 27,8 | 21,0 | 33,7 | 54,4 | 7,4 |
| AUGUST | 11,1 | 21,9 | 16,5 | 27,6 | 66,8 | 8,2 |
| SEPTEMBER | 12,1 | 21,4 | 15,6 | 27,7 | 71,6 | 7,6 |
| OCTOBER | 10,9 | 15,4 | 10,3 | 21,2 | 80,5 | 5,4 |
| NOVEMBER | 9,5 | 8,6 | 4,1 | 13,6 | 86,3 | 4,6 |
| DECEMBER | 8,7 | 4,9 | 1,2 | 9,9 | 86,7 | 5,4 |
| 2007 | DELTA t | Mean temperature | Minimum temperature | Maximum temperature | UR% | Wind speed km/h |
|---|---|---|---|---|---|---|
| JANUARY | 7,1 | 4,7 | 1,5 | 8,6 | 91,9 | 5,2 |
| FEBRUARY | 9,7 | 6,2 | 1,7 | 11,4 | 87,0 | 5,5 |
| MARCH | 11,2 | 10,1 | 4,5 | 15,7 | 67,8 | 9,0 |
| APRIL | 14,4 | 16,7 | 9,3 | 23,7 | 60,2 | 7,8 |
| MAY | 12,9 | 20,0 | 13,4 | 26,3 | 63,0 | 8,6 |
| JUNE | 11,9 | 23,3 | 17,4 | 29,3 | 68,0 | 7,1 |
| JULY | 14,6 | 26,0 | 18,3 | 32,9 | 53,1 | 7,9 |
| AUGUST | 12,3 | 23,7 | 17,5 | 29,8 | 63,0 | 8,3 |
| SEPTEMBER | 12,8 | 18,9 | 12,6 | 25,4 | 89,2 | 0,0 |
| OCTOBER | 10,8 | 13,5 | 8,4 | 19,2 | 76,5 | 7,0 |
| NOVEMBER | 11,2 | 7,4 | 2,2 | 13,4 | 77,3 | 8,0 |
| DECEMBER | 10,2 | 2,2 | -2,0 | 8,2 | 87,5 | 6,4 |
| 2008 | DELTA t | Mean temperature | Minimum temperature | Maximum temperature | UR% | Wind speed km/h |
|---|---|---|---|---|---|---|
| JANUARY | 7,7 | 4,8 | 1,3 | 9,0 | 91,4 | 7,4 |
| FEBRUARY | 11,4 | 5,2 | -0,3 | 11,1 | 80,5 | 7,0 |
| MARCH | 11,7 | 9,3 | 3,7 | 15,4 | 70,9 | 10,4 |
| APRIL | 11,2 | 13,0 | 7,4 | 18,6 | 71,9 | 10,4 |
| MAY | 11,5 | 19,2 | 13,5 | 25,0 | 66,6 | 10,8 |
| JUNE | 10,1 | 23,0 | 18,1 | 28,2 | 77,9 | 7,7 |
| JULY | 11,5 | 23,5 | 18,1 | 29,6 | 69,2 | 7,3 |
| AUGUST | 11,8 | 25,2 | 19,4 | 31,2 | 72,1 | 7,2 |
| SEPTEMBER | 10,3 | 19,0 | 14,3 | 24,6 | 77,2 | 8,8 |
| OCTOBER | 9,7 | 15,7 | 11,4 | 21,1 | 82,6 | 8,1 |
| NOVEMBER | 7,5 | 8,8 | 5,4 | 12,9 | 88,9 | 10,3 |
| DECEMBER | 6,9 | 4,1 | 1,0 | 7,9 | 93,1 | 10,4 |
| 2009 | DELTA t | Mean temperature | Minimum temperature | Maximum temperature | UR% | Wind speed km/h |
|---|---|---|---|---|---|---|
| JANUARY | 4,9 | 1,0 | -1,3 | 3,6 | 92,9 | 4,3 |
| FEBRUARY | 7,8 | 4,1 | 0,4 | 8,2 | 88,1 | 5,3 |
| MARCH | 10,8 | 9,0 | 3,5 | 14,3 | 67,7 | 7,2 |
| APRIL | 9,8 | 14,1 | 9,3 | 19,1 | 79,0 | 8,0 |
| MAY | 12,6 | 20,8 | 14,1 | 26,7 | 64,2 | 5,9 |
| JUNE | 12,0 | 22,9 | 16,4 | 28,4 | 64,2 | 6,8 |
| JULY | 10,9 | 25,3 | 19,6 | 30,5 | 67,6 | 5,5 |
| AUGUST | 11,6 | 26,8 | 20,8 | 32,4 | 64,0 | 5,7 |
| SEPTEMBER | 10,9 | 21,3 | 16,1 | 27,0 | 69,1 | 8,0 |
| OCTOBER | 9,8 | 13,6 | 8,9 | 18,7 | 77,6 | 5,2 |
| NOVEMBER | 5,7 | 9,3 | 6,4 | 12,1 | 94,7 | 5,3 |
| DECEMBER | 7,1 | 1,9 | -1,4 | 5,7 | 90,1 | 4,5 |
5.1. Observations on meteorological data
↑ ContentsMinimum and maximum temperatures and relative humidity were tabulated. Over the preceding six years, temperatures rarely fell below 0°C. Maximum temperatures were also relatively low, giving an average annual temperature variation of approximately 10.5°C. Mean annual relative humidity was approximately 77%. Monthly values peaked during colder months, generally exceeding 90%, and decreased during warmer months (see graph).
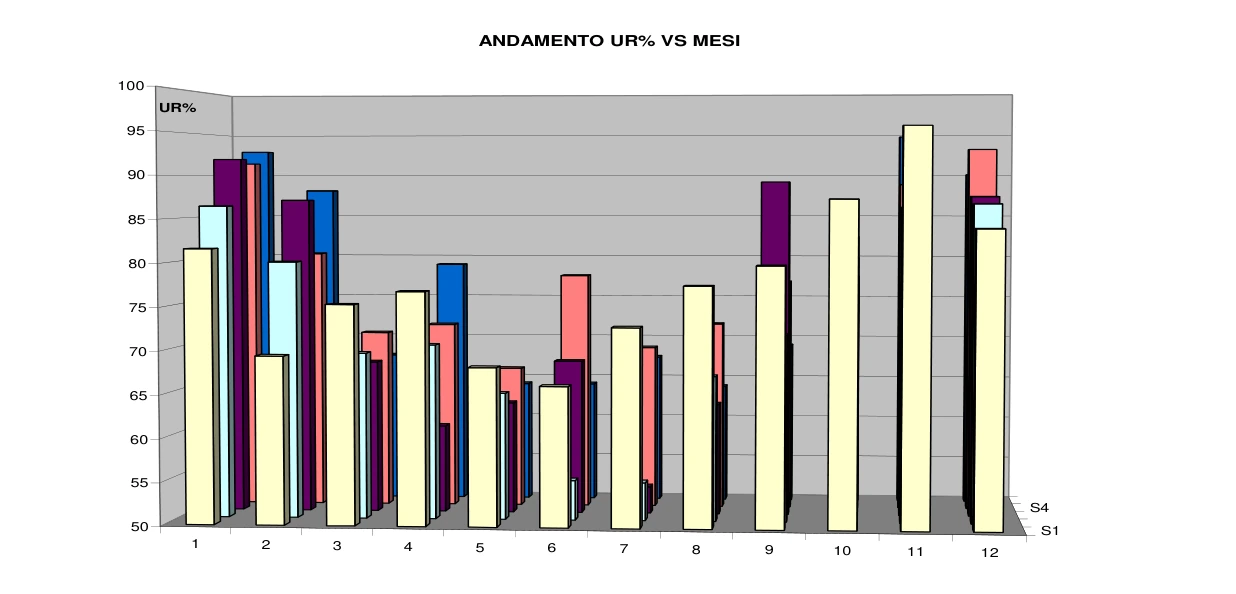
Graph of monthly mean relative humidity (RH%). Selected years were considered solely to check for a trend. The temperatures, modest thermal variations and relative humidity values indicate hygrothermal damage with a strong moisture component and a smaller thermal component.
6. Laboratory tests supporting the assessment
↑ ContentsMarmotest carried out constant-moment flexural strength testing to ASTM C880 (Appendix 1), water absorption to ASTM C97 (Appendix 2), breaking energy to UNI EN 14158 (Appendix 3), and a preliminary NT499 bowing test. The tests aimed to establish residual mechanical parameters and whether they remained compatible with the intended use.
Residual mechanical parameters were relatively low: mean flexural strength was 1.88 MPa ± 0.23 MPa. Table 1 of ASTM C503, Standard Specification for Marble Dimension Stone, specifies a minimum flexural strength of 6.9 MPa. For comparison, Carrara marbles generally range from 7 to 16 MPa. ASTM C97 water absorption gave an anomalous value of 0.35%, compared with typical marble values of 0.10%–0.16%. This anomaly is consistent with thermally induced damage. Increased porosity is linked to hygrothermal damage (Malaga et al., Experimental study on the variation in porosity of marble as a function of temperature). Impact testing also supports this finding: the mean was approximately 1.5 J, equivalent to a 1 kg sphere breaking a tile when dropped from 15 cm, well below typical marble values.
A qualitative NT499 bowing test was conducted on two specimens to establish whether further bowing remained possible or maximum curvature had already been reached. Only eight of the prescribed forty cycles were performed. Within eight cycles, both specimens bowed further by approximately 2 mm/m. The preliminary test therefore indicated that damage had NOT ceased and would continue over time.
7. Failure mechanism
↑ ContentsThe analyses indicate a combination of volumetric expansion and bowing. Both effects arise from one cause: weather-related hygrothermal action with a strong moisture component. The underlying phenomenon is associated with the specific thermal expansion characteristics of calcite crystals, which make up approximately 97% of this marble.

Like other minerals, calcite has an expansion coefficient that varies with crystallographic direction. Its distinctive behaviour is expansion along the principal crystallographic C axis and contraction perpendicular to it. The original report gives α = +26 × 10⁶ °C along C and α = −6 × 10⁻⁶ °C perpendicular to it; the first coefficient and the units are reproduced here as written in the historical source. Thus the crystal lengthens in one direction while shortening in the perpendicular direction (Figure 4).
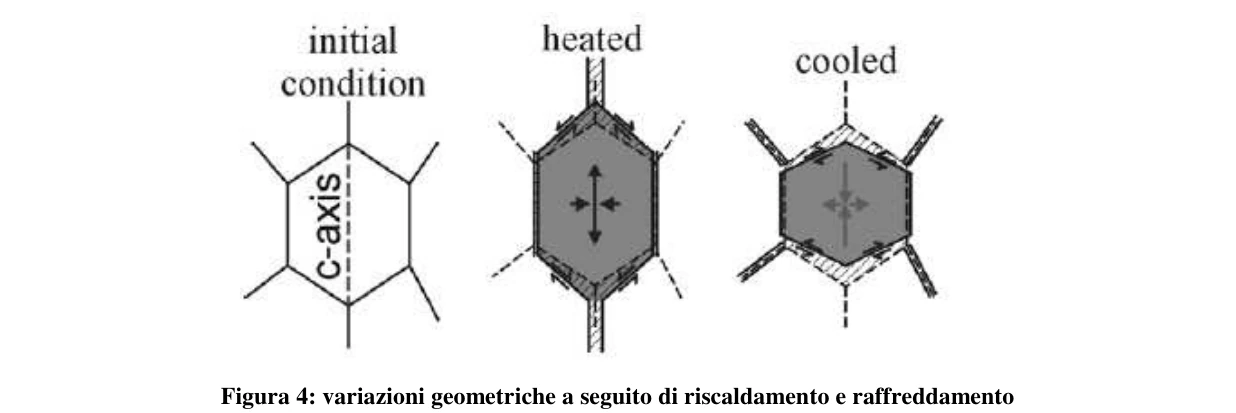
During each thermal cycle, the crystal assembly changes shape as shown in Figure 4. New intercrystalline voids form and marble porosity increases. Water enters these pores and eventually contributes to granular decohesion. Thermal fluctuations under dry conditions, without water, have been shown not to produce granular decohesion (see Figure
5). Volumetric expansion caused by granular decohesion (photographs 36 and 37) depends on the marble’s moisture content. Under dry conditions, expansion after 100 cycles of 20°C–80°C–20°C approaches 0.02% asymptotically. Under wet or partly wet conditions, expansion continues to rise, with reported values at the hundredth cycle of approximately 0.10 and 0.8, still increasing.

The precise role of water is not yet clear. Some recent theories propose that water vapour fills the temporary increase in pore space during heating. Vapour can become liquid water within pores even without reaching the dew-point temperature. During cooling, this water cannot drain out, so interstitial pressure from intercrystalline water opposes the reduction in porosity. This counterpressure accelerates granular decohesion.
8. Conclusions of the assessment
↑ ContentsBased on the site inspections, laboratory tests and comparison with the literature, the following conclusions can be drawn:
♦ All slabs on both east- and west-facing ventilated façades have bowed to differing degrees. Bow-meter measurements show slightly greater curvature in east-facing panels.
♦ Direct macroscopic examination identified cracks ranging from millimetres to centimetres along panel edges, and occasionally several decimetres. No panel contained a marble portion completely isolated by fractures and/or free surfaces. At the time of inspection, therefore, no freely removable marble portions were present.
♦ Bowing and volumetric expansion brought some adjacent cladding elements into contact, creating local stress concentrations, particularly at corners and edges, with incipient microcracks and occasional small missing pieces (photographs 15–18).
♦ No panel showed cracking, microfractures or spalling at anchorages caused by interference between bowing and the fixing.
♦ Bow-meter readings place the measured curvature within the “medium bowing” range (see table).
| Class | Bowing |
|---|---|
| Low bowing | 0,2–0,6 mm/m |
| Medium bowing | 7,1–11,9 mm/m |
| High bowing | 17,2–25,6 mm/m |
| Low Bowing | 0,2 mm/m – 0,6 mm/m |
|---|---|
| Medium Bowing | 7,1 mm/m – 11,9 mm/m |
| High Bowing | 17,2 mm/m – 25,6 mm/m |
♦ Petrographic analysis identified crystallographic features favouring bowing, specifically a holocrystalline-polygonal texture. Decoherence between crystals following hygrothermal action is evident. Weathering tends to break bonds with neighbouring crystals; visible cracks illustrate continuous propagation of granular decohesion from microscopic to macroscopic scale.
♦ Physical and mechanical tests on material sampled from the external cladding gave relatively low residual strength values (see appendices).
o Flexural strength: 1.9 MPa.
o Open porosity — water absorption: 0.34%.
o Impact energy: 1.5 J. These values indicate extremely low strength relative to the intended use. For comparison, ASTM C503 recommends a minimum strength of 6.9 MPa and maximum water absorption of 0.2% for marble. The preliminary NT499 test, specifically assessing susceptibility to bowing, showed that bowing remained active and would progress with further exposure, causing continuing cladding damage.
1- Taking into account the extremely low physical and mechanical strength values relative to the intended use;
2- Considering that even limited external forces, such as an earthquake or abnormal wind gusts, could significantly change the current condition and potentially detach portions of one or more panels, given the residual strength and overall cladding condition;
3- Further considering that damage is continuing to develop, as demonstrated by the NT499 test;
TO EXCLUDE EVEN THE POTENTIAL FALL OF MATERIAL FRAGMENTS, REMOVAL OF ALL MARBLE CLADDING FROM THE BUILDING UNDER INVESTIGATION IS RECOMMENDED.
Bibliography
↑ Contents• Burkhard M. (1993). Calcite-twins, their geometry, appearence and significance as stress-strain markers and indicators of tectonic regime: a review. J. Struct. Geol. 15: 351- 368.
• Passchier C. W. & Trouw R. A. J. (1998). Micro-tectonics. Springer-Verlag, pp 289. Schmid R., Fettes D., Harte B., Davis E. and Desmons J. (2007). How to name a metamorphic rock. Recommendations by the IUGS Subcommission on the Systematics of Metamorphic Rocks: Web version 01/02/07.
• Alnæs, L., Koch, A. ,Schouenborg, B., Åkesson, U., Lindborg, U. & Moen, K. 2004., Influence of rock and mineral proper-ties on the durability of marble panels. Proc. Dimension Stone 2004.
• Kessler, D.W. 1919. Physical and chemical tests on the com-mercial marbles of the United States. Technological papers of the Bureau of Standards No. 123.
• Kleber, W. 1990. Einführung in die Kristallographie. Berlin: VEB Verlag Technik.
• Koch, A. & Siegesmund, S. 2004. The combined effect of moisture and temperature on the anomalous expansion be-hav-iour of marble. In: S. Siegesmund, H. Viles & T. Weiss (eds), Stone decay hazards, Environmental Geology, in press.
• Malaga, K., Scouenburg, B.,Alnæs, L, Bellopede, R. & Brun-din, J.-A. 2004. Field exposure sites and accelerated labora-tory test of marble panels, Proc. Dimension Stone 2004.
• Passchier, C.W. & Trouw, R.A:J. 1996. Microdefects. Springer verlag.
• Perrier, R & Bouineau, A. 1997, La descohesión Térmica en mármoles y calizas marmóreas, Roc Maquina.
• NT Build 499 2002, Cladding panels. Test for Bowing.
• Ruedrich, Weiss, J.T. & Siegesmund, S. 2001. Deterioration characteristics of marbles from the Marmorpalais Potsdam. Zeitschrift der Deutschen Geologischen Gesellschaft 152: 637-664.
• NT Build 500 2002-05, , Cladding panels, Field Method for measurement of bowing
• Spry, A. 1983. Metamorphic textures, Pergamon Press.
• Yates, T., Brundin, J.-A., Goltermann, P. & Grelk, B. 2004., Observations from inspection of marble cladding in Europe. Proc. Dimension Stone 2004.
• Team final report